MADS Demos
ABAGUS: Agent-based Global Uncertainty and Sensitivity analysis
 [click to enlarge]
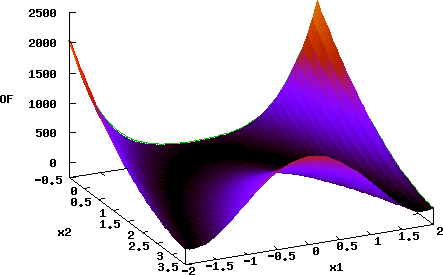
The movie above shows an animation of the hierarchical еxploration of 2D parameter space by ABAGUS for the case of a simple parabola test model (keyword 'test=1'). The acceptable parameter space solution is in the area with radius of about 14 from the global minimum at (0,0) with objective function (OF) cutoff value below 160 (keyword 'cutoff=160'). The parameter space domain is [-100,100] (keyword 'pardomain=200') for both model parameters. Only, [-20,20] range is shown in the figure below.
ABAGUS performs a series of analyses with different discretization sizes: 10, 5, 2.5, 1.25, etc. The location of the agents is shown by cyan stars (the agents explore the parameter space outside of the shown domain as well.
Response surface of the parabola test function: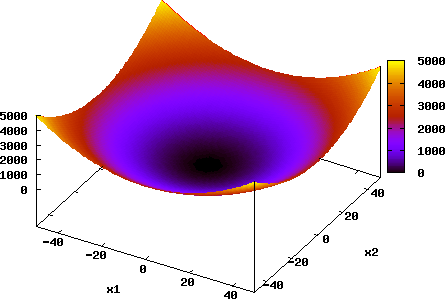 [click to enlarge]
ABAGUS performance is compared to MADS Monte Carlo analysis using Improved Distributed Latin Hypercube Sampling (IDLHS).
Comparison of both methods based on the number of functional evaluations: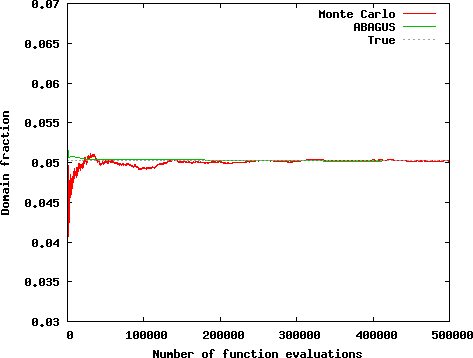 [click to enlarge]
The results demonstrate that ABAGUS outperforms the Monte Carlo analysis using Improved Distributed Latin Hypercube Sampling (IDLHS).
Squads: Global Optimization technique coupling Particle Swarm and Levenberg-Marquardt optimization techniques
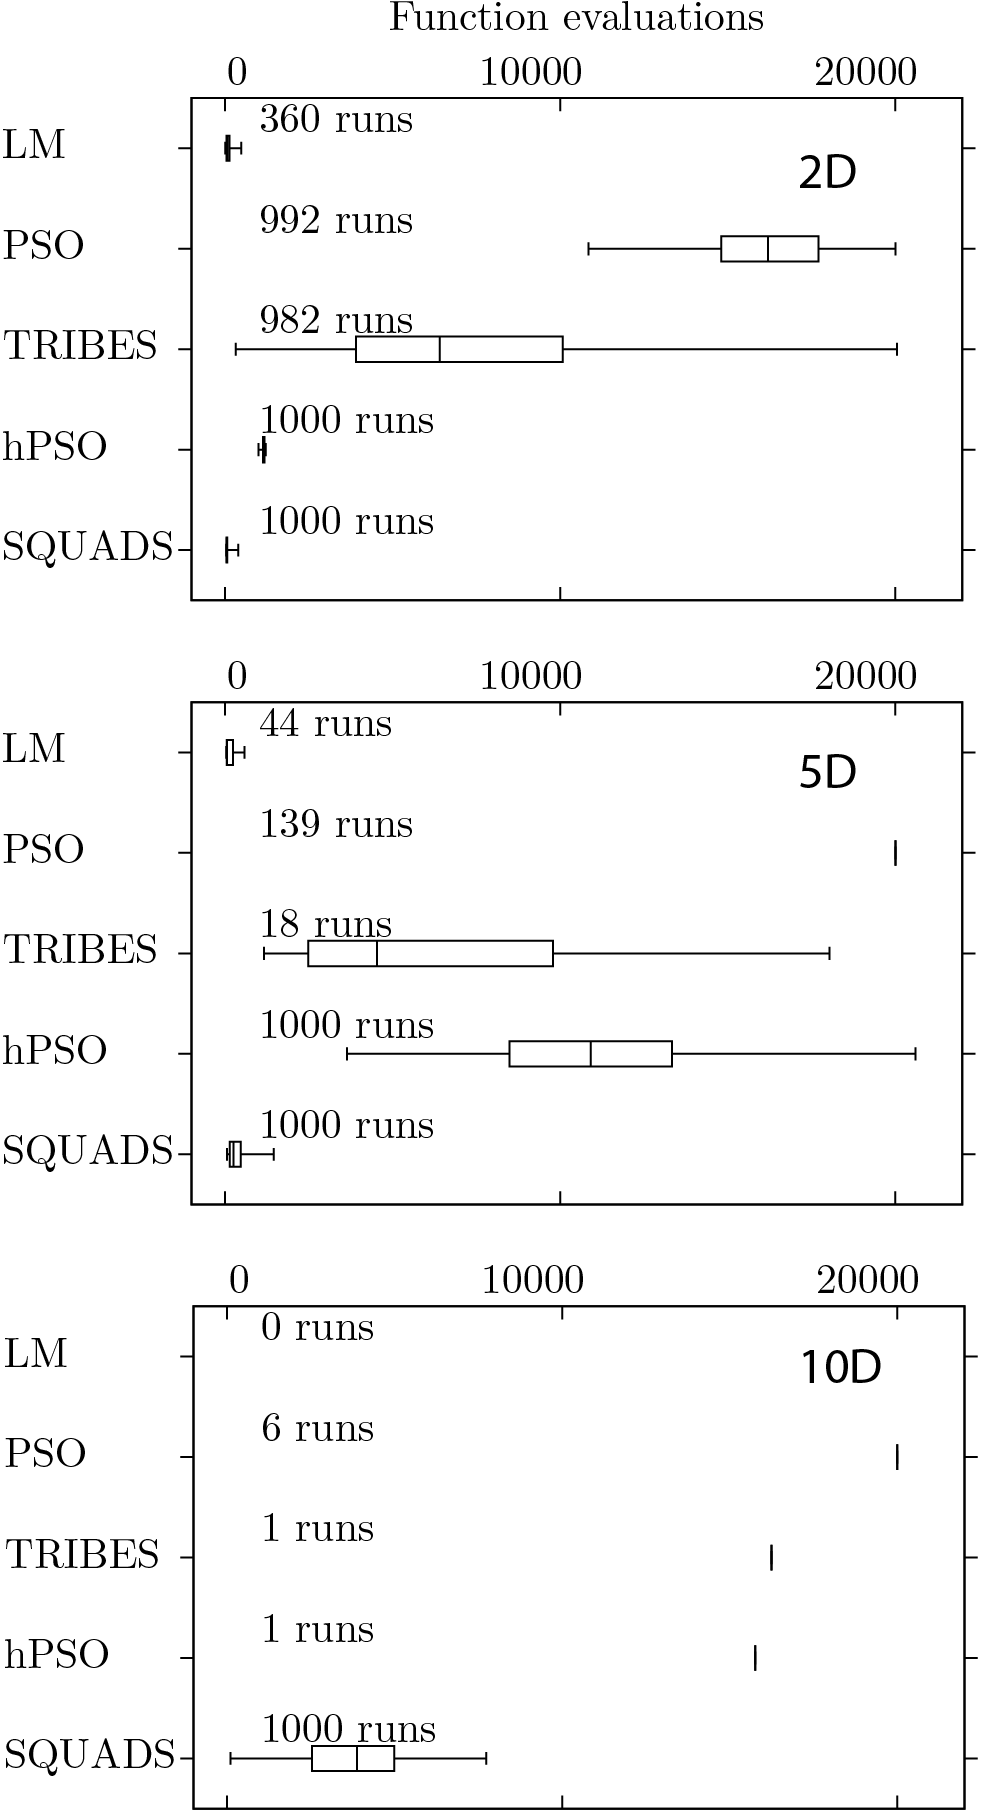
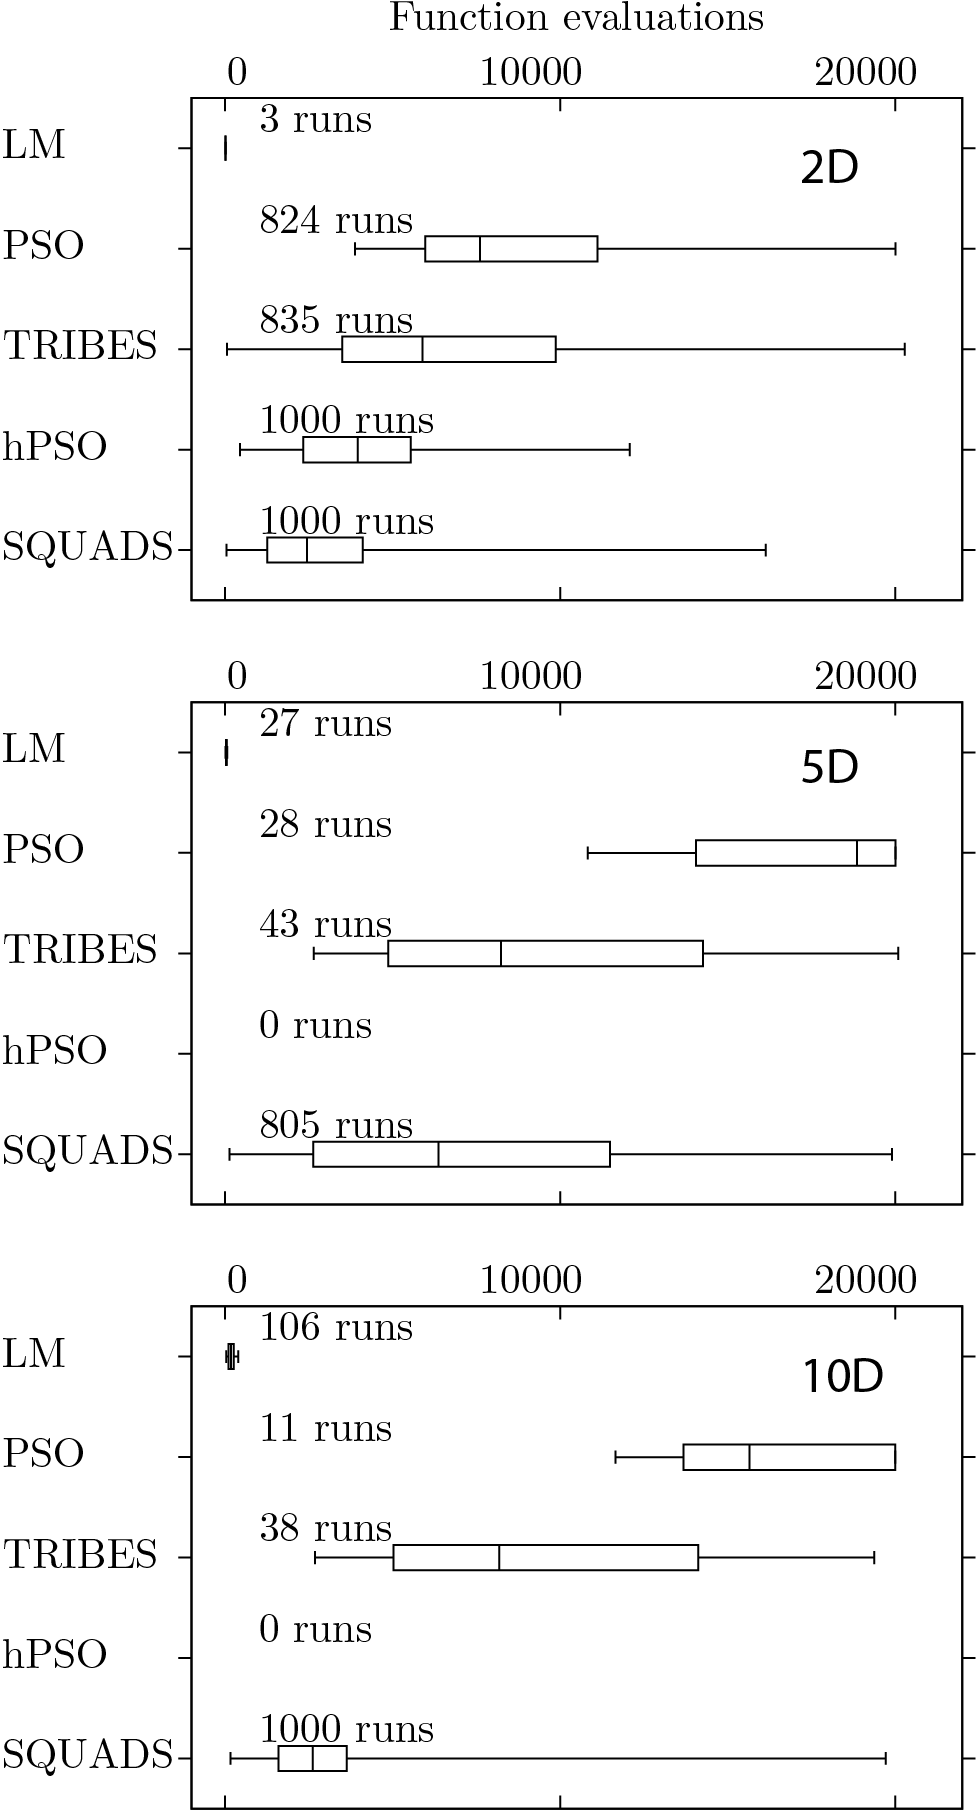
Comparisons are performed between LM (Levenberg-Marquardt), PSO (Particle Swarm Optimization), TRIBES , hPSO and Squads to solve Rosenbrock and Griewank test problem with different dimensionality (i.e. number of adjustable parameters).
Figures below present boxplots for the number of function evaluations for successful runs for 2D, 5D, and 10D Rosenbrock and Griewank test functions, respectively. In the figures, the boxes represent the 25th to 75th percentile ranges, the bars inside of the boxes represent the median values, and the whiskers represent the minimum and maximum values. The fraction of successful runs out of the attempted runs are presented above the boxes.
The robustness of the strategies is defined as the percentage of successful runs.
The efficiency of the strategies is defined by the number of functional evaluations required to achieve the global minimum.
Squads is as robust or more robust than the other tested strategies (LM, PSO, TRIBES, and hPSO) in all cases.
Squads is more efficient than PSO, TRIBES, and hPSO in all cases.
For the 2D, 5D, and 10D Rosenbrock test functions, Squads has comparable efficiency to LM.
However, in these cases, the robustness of Squads (100%) is considerably better than the robustness of LM (less than 36%).
For the 2D, 5D, and 10D Griewank test functions, Squads is less efficient than LM but depending on the initial guesses may converge for the same number of functional evaluations as LM.
However, in these cases, the robustness of Squads (grater than 80%) is considerably better than the robustness of LM (less than 11%).
Squads is observed to have the best performance when both robustness and efficiency are taken into consideration than the other strategies.